24.05.2021, 22:25
|
#1 |
|
Member
Регистрация: 11.11.2015
Сообщений: 1,429
|
The sentiment in the crypto sector is extremely bearish. On May 23, several altcoins dipped below the May 19 panic low, suggesting that traders continue to sell at every opportunity. However, Bitcoin (BTC) did not violate its May 19 panic low at $29,257.95, indicating buying at lower levels.
John Bollinger, the creator of the Bollinger Bands indicator, believes Bitcoin could be forming a W-shaped bottom, which may have a good risk to reward ratio. In another positive sign, PlanB, the creator of the stock-to-flow Bitcoin price model, said that a large part of the selling has been done by traders who had purchased in the $55,000 to $60,000 zone in April. These traders dumped about 1 million Bitcoin in the $30,000 to $35,000 zone in May. According to PlanB, the whales have bought aggressively during the current dip, which is a positive sign as “1 million Bitcoin are in strong hands now.”  Daily cryptocurrency market performance. Source: Coin360Another insight about Bitcoin whale purchases was shared by Morgan Creek Digital’s Anthony Pompliano who referenced data from Glassnode. During the crash on May 19, Bitcoin whales owning between 10,000 and 100,000 Bitcoin*bought 122,588 Bitcoin. Several crypto hedge funds interviewed by Bloomberg also said they had been buyers at lower levels. Daily cryptocurrency market performance. Source: Coin360Another insight about Bitcoin whale purchases was shared by Morgan Creek Digital’s Anthony Pompliano who referenced data from Glassnode. During the crash on May 19, Bitcoin whales owning between 10,000 and 100,000 Bitcoin*bought 122,588 Bitcoin. Several crypto hedge funds interviewed by Bloomberg also said they had been buyers at lower levels.What is clear is that whales have been buying the dips. Does this suggest that a bottom may be in place or could crypto prices fall further? Let’s analyze the charts of the top-10 cryptocurrencies to find out. BTC/USDT Bitcoin broke below the $33,496.82 support on May 23 but the bears could not pull the price down to the May 19 low at $29,257.95. The long tail on the May 23 candlestick suggests the bulls purchased the dips aggressively.  BTC/USDT daily chart. Source: TradingViewThe buyers are attempting to build upon the recovery today and have pushed the price above the downtrend line. If the bulls can sustain the price above the downtrend line, the BTC/USDT pair could rise to $42,000 and then to the 20-day exponential moving average ($44,965). BTC/USDT daily chart. Source: TradingViewThe buyers are attempting to build upon the recovery today and have pushed the price above the downtrend line. If the bulls can sustain the price above the downtrend line, the BTC/USDT pair could rise to $42,000 and then to the 20-day exponential moving average ($44,965).If the price turns down from the 20-day EMA, it will suggest the sentiment remains negative and traders are selling on rallies. That could keep the pair range-bound between $28,850 and $45,000 for a few days. Contrary to this assumption, if the price fails to sustain above the downtrend line, it will suggest that traders are selling on minor rallies. That will increase the possibility of a retest of $28,850. A break below this level could result in a fall to $20,000. ETH/USDT Ether (ETH) dipped below the May 19 intraday low at $1,801.60 on May 23 but the long tail on the day’s candlestick suggests the bulls aggressively bought at lower levels. The buyers have extended the recovery today, which is a positive sign.  ETH/USDT daily chart. Source: TradingViewThe ETH/USDT pair could rally to the 38.2% Fibonacci retracement level at $2,724.05, which is likely to act as a stiff resistance. The moving averages are on the verge of a bearish crossover and the RSI is in the negative territory, indicating advantage to the bears. ETH/USDT daily chart. Source: TradingViewThe ETH/USDT pair could rally to the 38.2% Fibonacci retracement level at $2,724.05, which is likely to act as a stiff resistance. The moving averages are on the verge of a bearish crossover and the RSI is in the negative territory, indicating advantage to the bears.If the price turns down from $2,724.05, the bears will make one more attempt to resume the downtrend. A break below $1,703.77 could open the doors for a further decline to $1,547.46 and then $1,289. The first sign of strength will be a breakout and close above the 20-day EMA ($2,959). Such a move will suggest that the downtrend could be over. BNB/USDT Binance Coin (BNB) broke below $233.81 on May 23, completing a 100% retracement of the entire leg of the rally that had started on March 26. However, the long tail on the May 23 candlestick suggests the bulls have not given up yet.  BNB/USDT daily chart. Source: TradingViewThe buyers are trying to start a relief rally that may face resistance at $348.70 and then again at $428. The moving averages have completed a bearish crossover and the RSI is near the oversold territory, suggesting advantage to the bears. BNB/USDT daily chart. Source: TradingViewThe buyers are trying to start a relief rally that may face resistance at $348.70 and then again at $428. The moving averages have completed a bearish crossover and the RSI is near the oversold territory, suggesting advantage to the bears.If the price turns down from the overhead resistance, the bears will make another attempt to resume the downtrend. If the sellers break the $211.70 to $200 support zone, the selling could intensify further and the BNB/USDT pair could decline to $120. Contrary to this assumption, if the bulls defend the $211.70 support during the next decline, it will suggest that the correction may be over and the pair could then start a bottoming process. ADA/USDT Cardano (ADA) again dropped near the $1 support on May 23 and the long tail on the day’s candlestick suggests the bulls purchased the dip aggressively. This makes the $1 level an important support to watch out on the downside.  ADA/USDT daily chart. Source: TradingViewThe buyers are currently trying to sustain the price above the $1.48 resistance. If they succeed, the ADA/USDT pair could rise to the 20-day EMA ($1.62) where the bears are again likely to mount a stiff resistance. ADA/USDT daily chart. Source: TradingViewThe buyers are currently trying to sustain the price above the $1.48 resistance. If they succeed, the ADA/USDT pair could rise to the 20-day EMA ($1.62) where the bears are again likely to mount a stiff resistance.If the price turns down from the 20-day EMA, it will suggest the sentiment remains bearish and the pair could then consolidate between $1 and $1.63 for a few days. Alternatively, if the bulls push the price above the 20-day EMA, the pair could rally to $1.94 and then to the all-time high at $2.34. On the downside, a break below the $1 to $0.95 support zone could result in panic selling. DOGE/USDT After staying above the 50-day simple moving average ($0.33) from May 20 to 22, Dogecoin (DOGE) broke below it on May 23. However, the bulls bought the dip and are currently attempting to push the price back above the 50-day SMA. 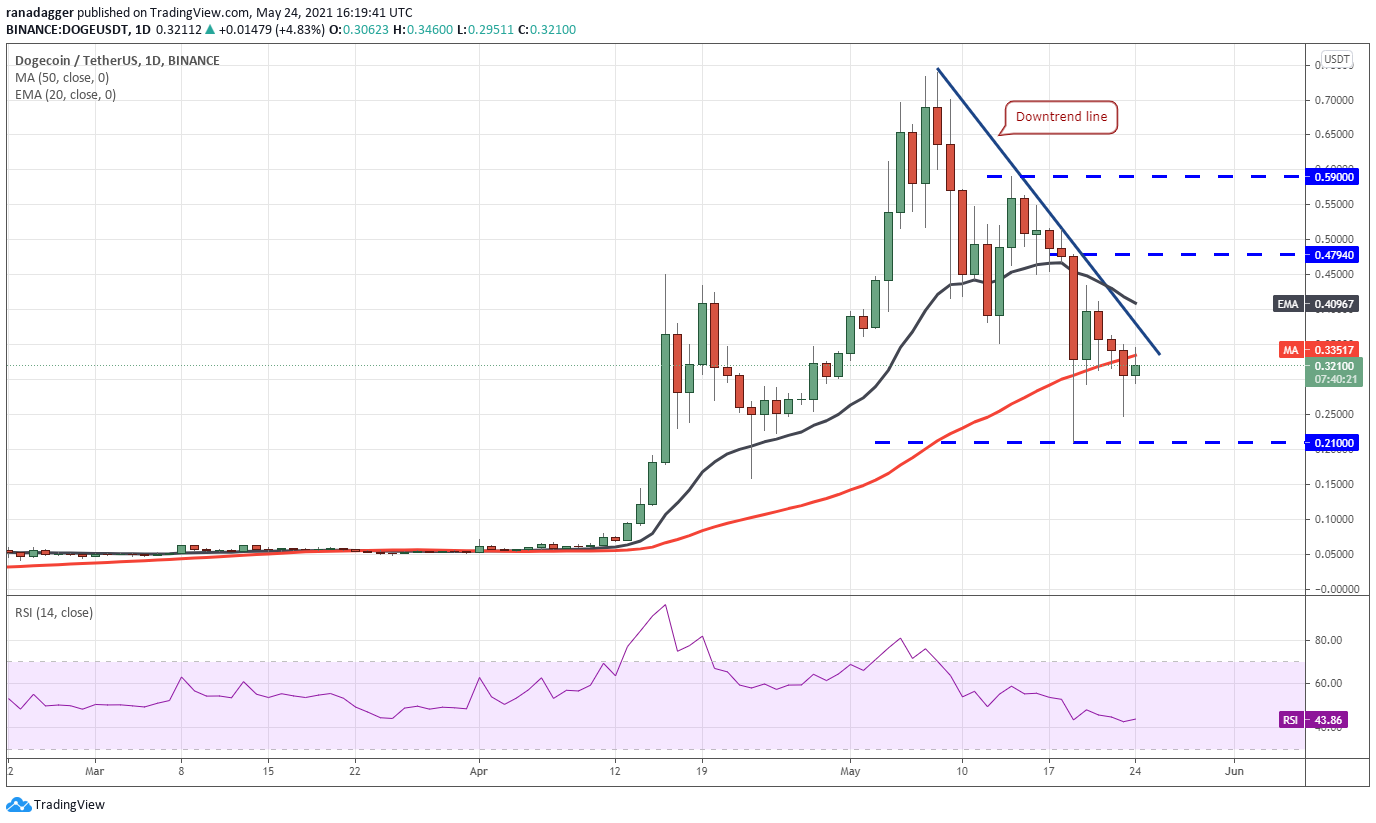 DOGE/USDT daily chart. Source: TradingViewThe relief rally is likely to face resistance near the downtrend line and then at the 20-day EMA ($0.40). If the price turns down from either resistance, the bears will make one more attempt to break the $0.21 support. DOGE/USDT daily chart. Source: TradingViewThe relief rally is likely to face resistance near the downtrend line and then at the 20-day EMA ($0.40). If the price turns down from either resistance, the bears will make one more attempt to break the $0.21 support.If that happens, the DOGE/USDT pair could drop to $0.15 and then to $0.10. The downsloping 20-day EMA and the RSI below 44 suggest the bears have the upper hand. This negative view will invalidate if the bulls push the price above the 20-day EMA. In such a case, the pair could rally to $0.47 and then to $0.59. XRP/USDT XRP slipped and closed below the $0.88 support on May 23, suggesting the bears are in command. However, the bulls have not given up yet and are trying to push the price back above $0.88 today. If they manage to do that, the altcoin could start a relief rally that may reach the 20-day EMA ($1.22).  XRP/USDT daily chart. Source: TradingViewThe bears are likely to defend the 20-day EMA. If the price turns down from this resistance, the XRP/USDT pair could drop to $0.88 and then to $0.65. A break below this support could result in a decline to $0.56. XRP/USDT daily chart. Source: TradingViewThe bears are likely to defend the 20-day EMA. If the price turns down from this resistance, the XRP/USDT pair could drop to $0.88 and then to $0.65. A break below this support could result in a decline to $0.56.On the contrary, if the bulls push the price above the moving averages, the pair could rally to the downtrend line. A breakout and close above the downtrend line will indicate that the downtrend could be over. DOT/USDT After a brief struggle near the $26.50 level on May 20 and 21, the bears asserted their supremacy on May 22 and pulled Polkadot (DOT) lower. The altcoin dropped to $13.63 on May 23 but the bulls purchased this dip forming a long tail on the candlestick.  DOT/USDT daily chart. Source: TradingViewThe bulls are attempting to build upon the recovery today, which may reach the breakdown level at $26.50. If the price turns down from this resistance but stays above $15, then a few days of range-bound action is possible. DOT/USDT daily chart. Source: TradingViewThe bulls are attempting to build upon the recovery today, which may reach the breakdown level at $26.50. If the price turns down from this resistance but stays above $15, then a few days of range-bound action is possible.A breakout and close above $26.50 will be the first sign of strength and the momentum could favor the bulls if they can push the price above the 20-day EMA ($31.93). Conversely, if the bears sink the price below the $15 to $13.63 support zone, the DOT/USDT pair could extend the decline to $7.98. BCH/USDT Bitcoin Cash (BCH) has witnessed a waterfall decline in the past few days, dropping from a high at $1,638.08 on May 12 to a low at $467.58 on May 23, a 71% fall in a short time. Generally, after such a sharp fall, a strong pullback could be expected. 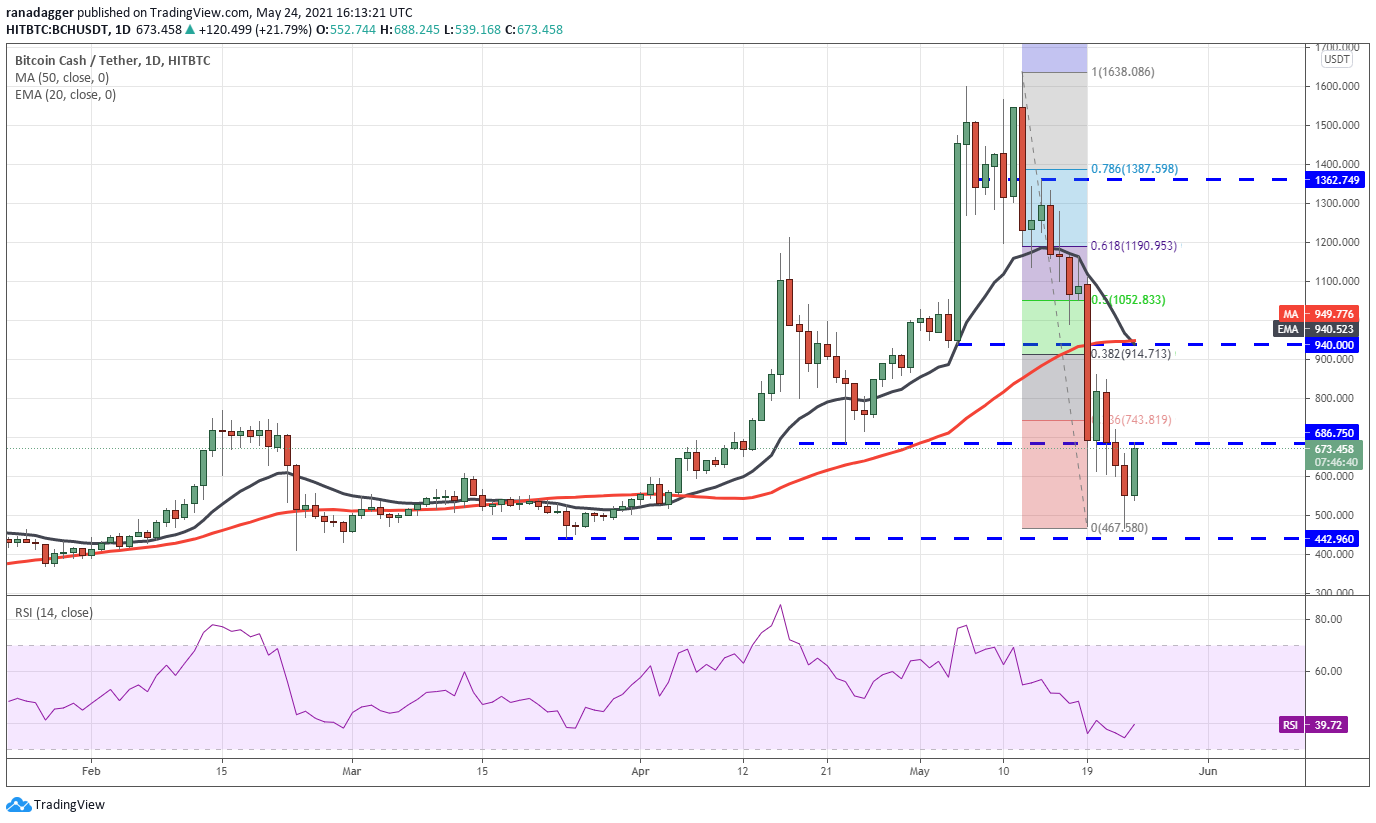 BCH/USDT daily chart. Source: TradingViewIf the bulls push and sustain the price above $686.75, the relief rally could extend to the 38.2% Fibonacci retracement level at $914.71. This level is likely to act as a stiff resistance but if the bulls can push the price above it, the BCH/USDT pair could rise to $1,100. BCH/USDT daily chart. Source: TradingViewIf the bulls push and sustain the price above $686.75, the relief rally could extend to the 38.2% Fibonacci retracement level at $914.71. This level is likely to act as a stiff resistance but if the bulls can push the price above it, the BCH/USDT pair could rise to $1,100.Contrary to this assumption, if the price turns down from $914, the pair may oscillate between $467.58 and $914 for a few days. A breakdown and close below $442.96 will be a huge negative as that could result in a drop to $370. UNI/USDT Uniswap (UNI) broke below the $17.50 to $16 support zone on May 23 and hit a low at $13. However, the long tail on the candlestick suggests the bulls purchased the dip.  UNI/USDT daily chart. Source: TradingViewThe UNI/USDT pair has started a relief rally today that could reach the 38.2% Fibonacci retracement level at $25.22. The downsloping moving averages and the RSI near the oversold territory suggest the bears have the upper hand. UNI/USDT daily chart. Source: TradingViewThe UNI/USDT pair has started a relief rally today that could reach the 38.2% Fibonacci retracement level at $25.22. The downsloping moving averages and the RSI near the oversold territory suggest the bears have the upper hand.If the price turns down from $25.22, the bears will make one more attempt to resume the downtrend. A break below $13 could open the doors for a drop to the next support at $10. Alternatively, a break above $25.22 could push the price to the 20-day EMA ($30.25). This level is again likely to act as stiff resistance but if the bulls can push the price above it, the pair could rise to $36. LTC/USDT Litecoin (LTC) rebounded off the $118 support on May 23, which suggests buying at lower levels. The bulls are trying to extend the recovery today. If they can push the price above $187.75, the altcoin could reach the 38.2% Fibonacci retracement level at $230.75.  LTC/USDT daily chart. Source: TradingViewThe downsloping 20-day EMA ($246) and the RSI near the oversold territory suggest the bears are in the driver’s seat. If the price turns down from this resistance, the bears will attempt to sink the price below $118. LTC/USDT daily chart. Source: TradingViewThe downsloping 20-day EMA ($246) and the RSI near the oversold territory suggest the bears are in the driver’s seat. If the price turns down from this resistance, the bears will attempt to sink the price below $118.If they succeed, the LTC/USDT pair could drop to $95 and then to $80. This negative view will invalidate if the bulls push the price above the moving averages. Such a move could result in a rally to the 61.8% retracement level at $300.25. The views and opinions expressed here are solely those of the author and do not necessarily reflect the views of Cointelegraph. Every investment and trading move involves risk. You should conduct your own research when making a decision. Market data is provided by HitBTC exchange. |

|

|